Introduction
Internet-facing services commonly receive a mixture of measurement, reconnaissance, credential attempts, exploit-shaped requests, and unrelated background traffic [1]. A source address is a network identifier, not a person, organization, or actor. This paper therefore keeps observations, inferred behavior, and confirmed effects separate.
The research question is: what qualifying telemetry units and evidence-bounded behavioral patterns were observed over the fixed seven-day event-time window at one public address? The study is not a prevalence estimate, controlled experiment, or attribution exercise.
Related Work
Internet background radiation and address-history effects motivate cautious interpretation of any one-address deployment [1] [2]. Internet-wide measurement research also establishes that rapid observation of public IPv4 space is not, by itself, a novel finding [3]. Honeypot telemetry is useful for observing interaction with emulated services, but it requires care because sensors emit heterogeneous record types [4] [5].
Methodology
This is a single-address, single-provider, seven-day observational case study; it cannot estimate provider-wide or Internet-wide behavior.
Study boundary and time origin
The authoritative window is half-open: @timestamp >= 2026-08-25T21:48:08Z and @timestamp < 2026-09-01T21:48:08Z. It spans 604,800 seconds. t0 is the earliest indexed operational event in the frozen Elasticsearch corpus. Because network exposure time is not known, elapsed event times are not exposure-to-discovery latency.
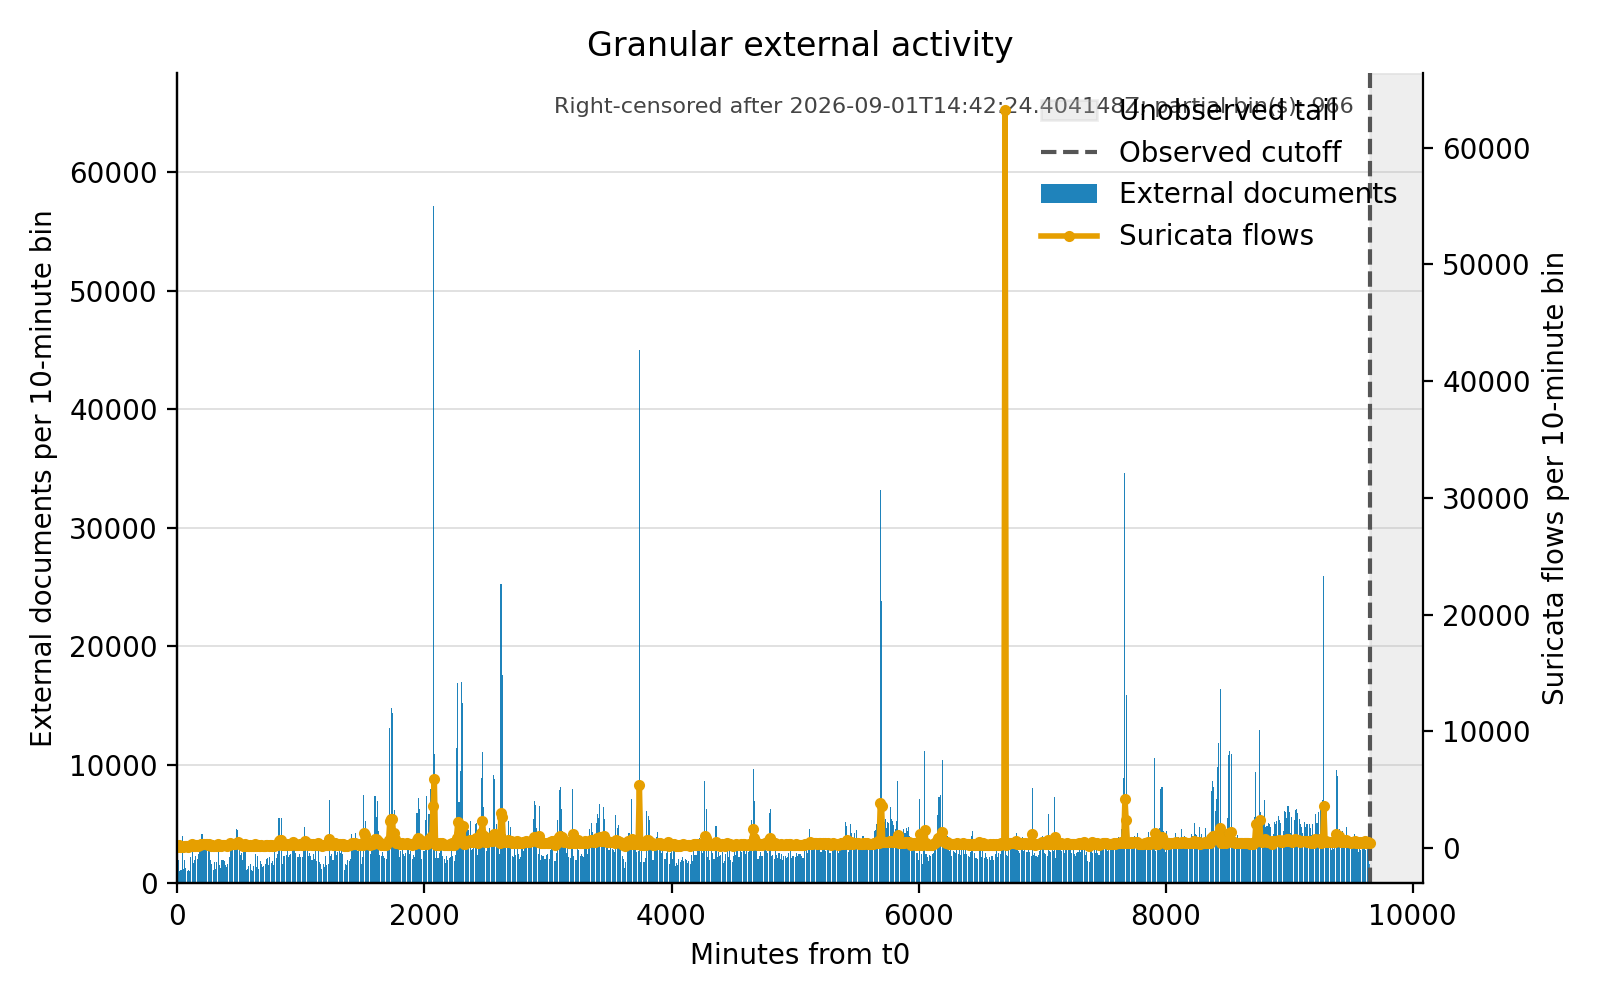
Coverage status is incomplete_right_censored, with records observed through 2026-09-01T14:42:24.404148Z. Coverage is incomplete and right-censored at that point; the unobserved tail is 25,544 seconds. Missing future events are not zero observations.
Analytic populations and units
The public analysis excludes verified sensor-originated, private, and unusable source values before external-source aggregation. An indexed document is not necessarily a network connection; a p0f contact tuple is not necessarily a completed connection; a Suricata flow is not a session; a Cowrie session is not a real-host login; and an application request record is not proof of exploitation.
Scanner-excluded sensitivity analysis
The deterministic rule is: exclude every observation from a source with an explicit Cortex Xpanse or Censys scanner self-identification. It identified 1,464 source addresses across 110,331 qualifying observations. This is a sensitivity analysis only; remaining traffic is not thereby established as malicious.
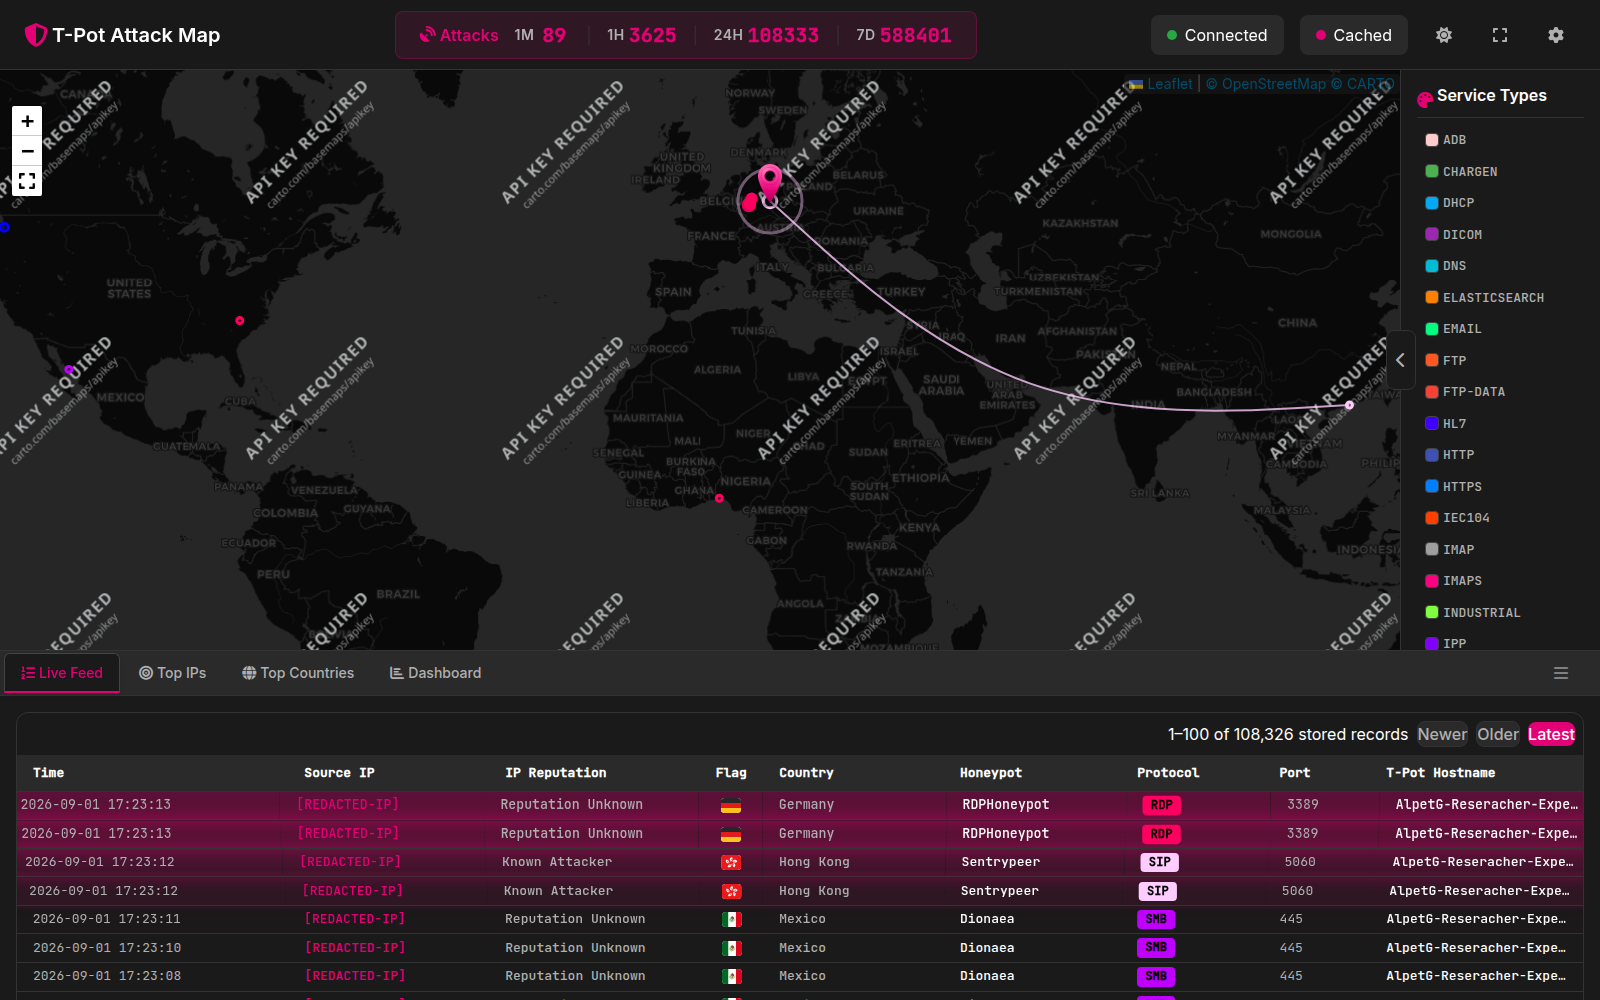
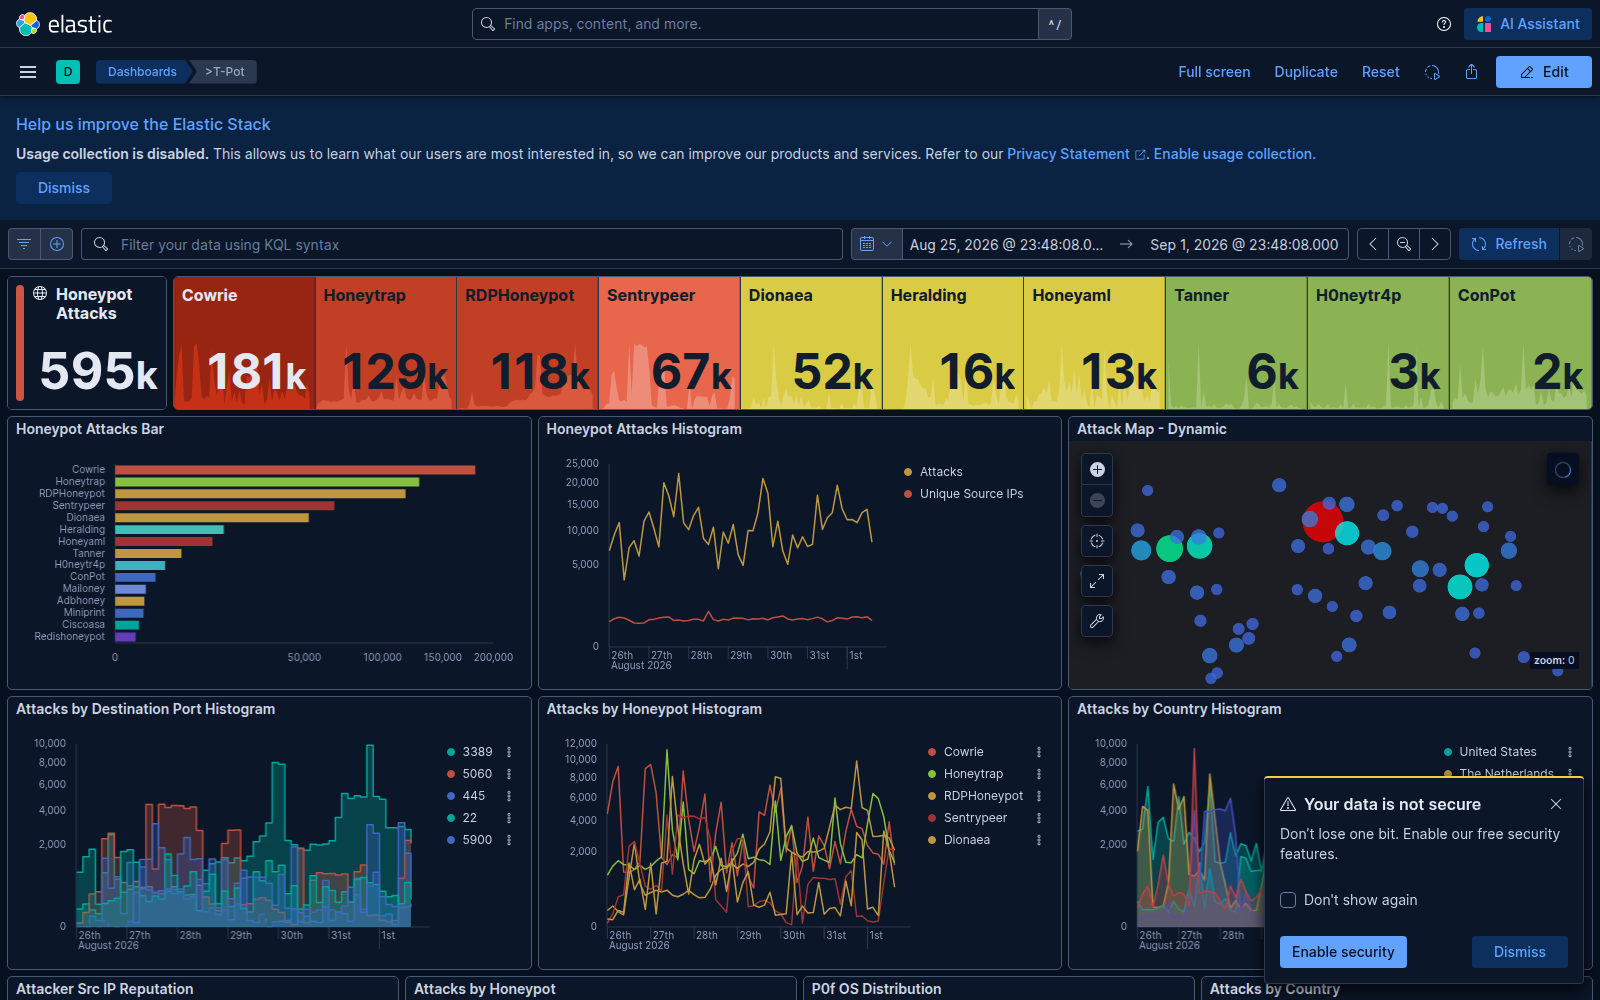
Contextual screenshots
Contextual screenshot metadata is retained separately from the analytical record. Contextual evidence only; frozen telemetry and derived metrics remain authoritative. Source addresses are redacted in the published captures.
Dataset
| Population | Count | Unit and qualification |
|---|---|---|
| Raw Elasticsearch documents | 4,724,688 | Indexed records; not attacks or connections |
| External-source documents | 3,796,496 | Documents passing the external-source rule |
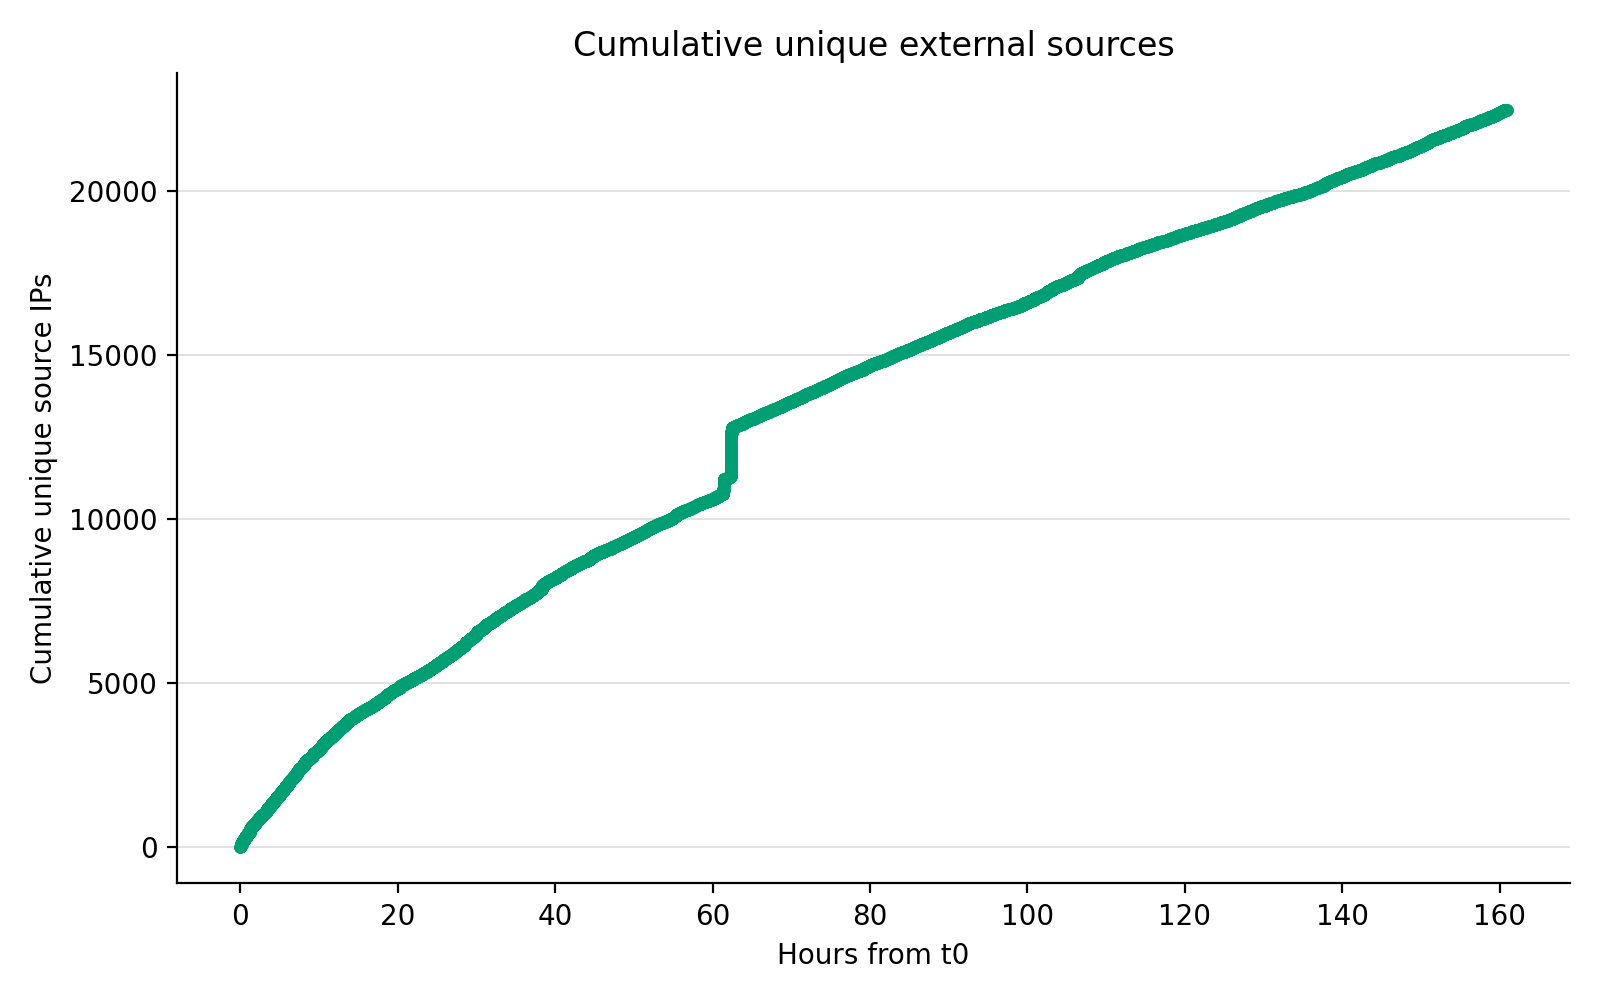
| Unique external source IPs | 22,485 | Network identifiers, not people |
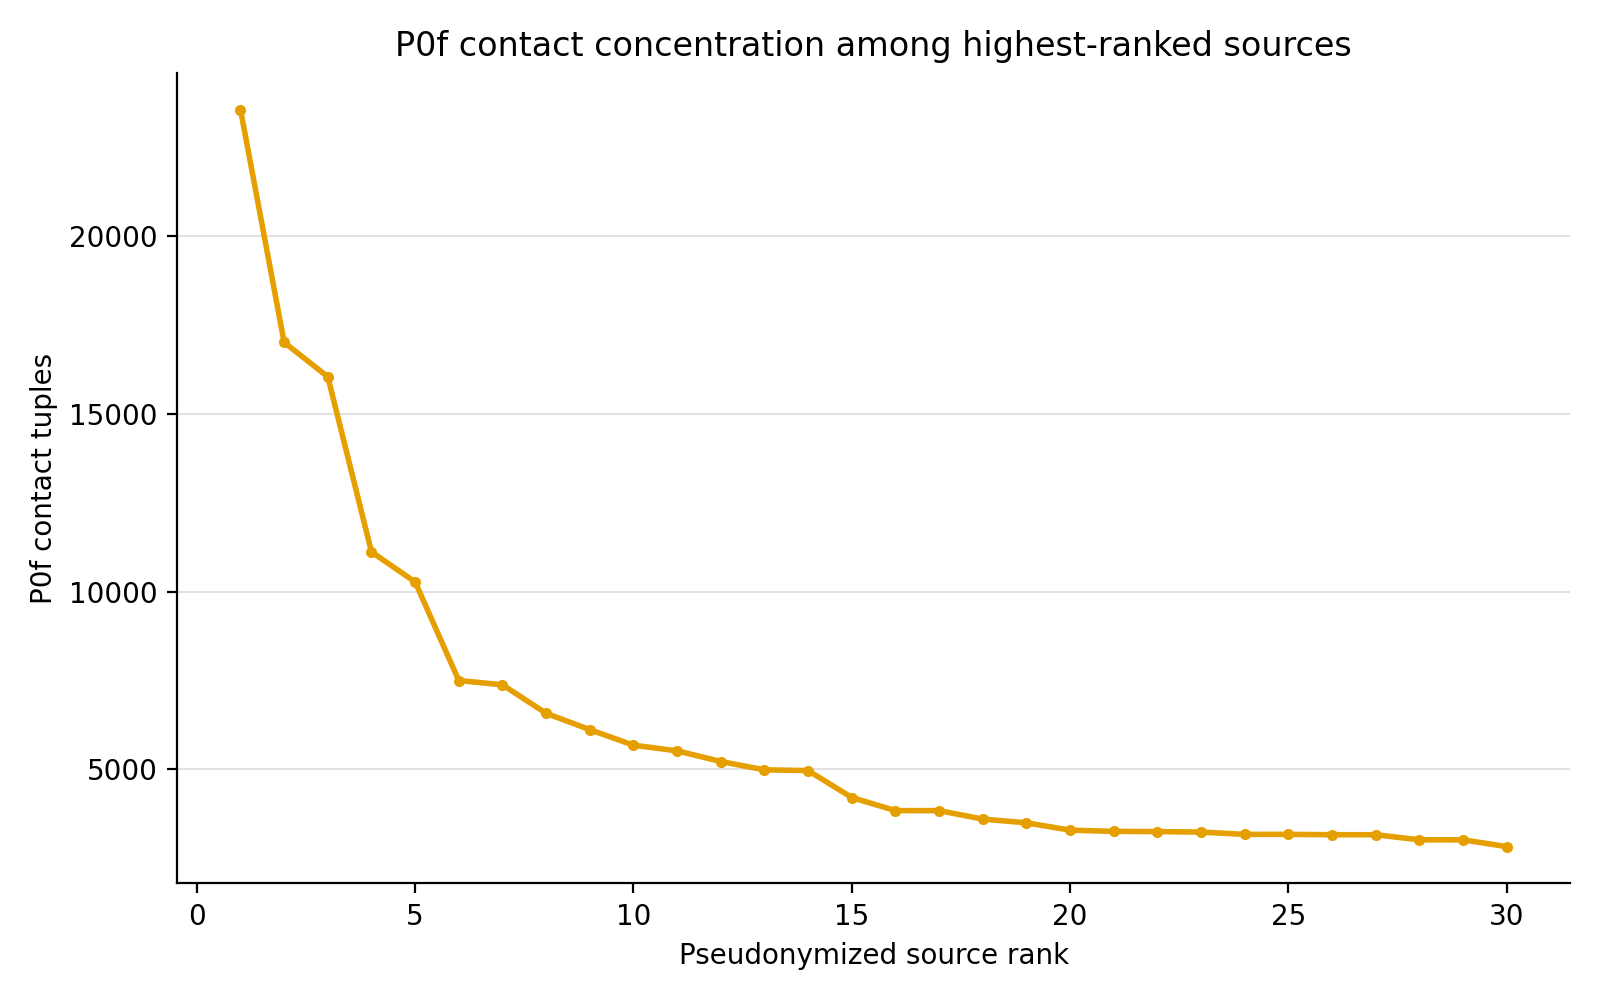
| p0f contact tuples | 465,659 | Deduplicated contact observations |
| Suricata flow records | 546,712 | Flow telemetry, not sessions |
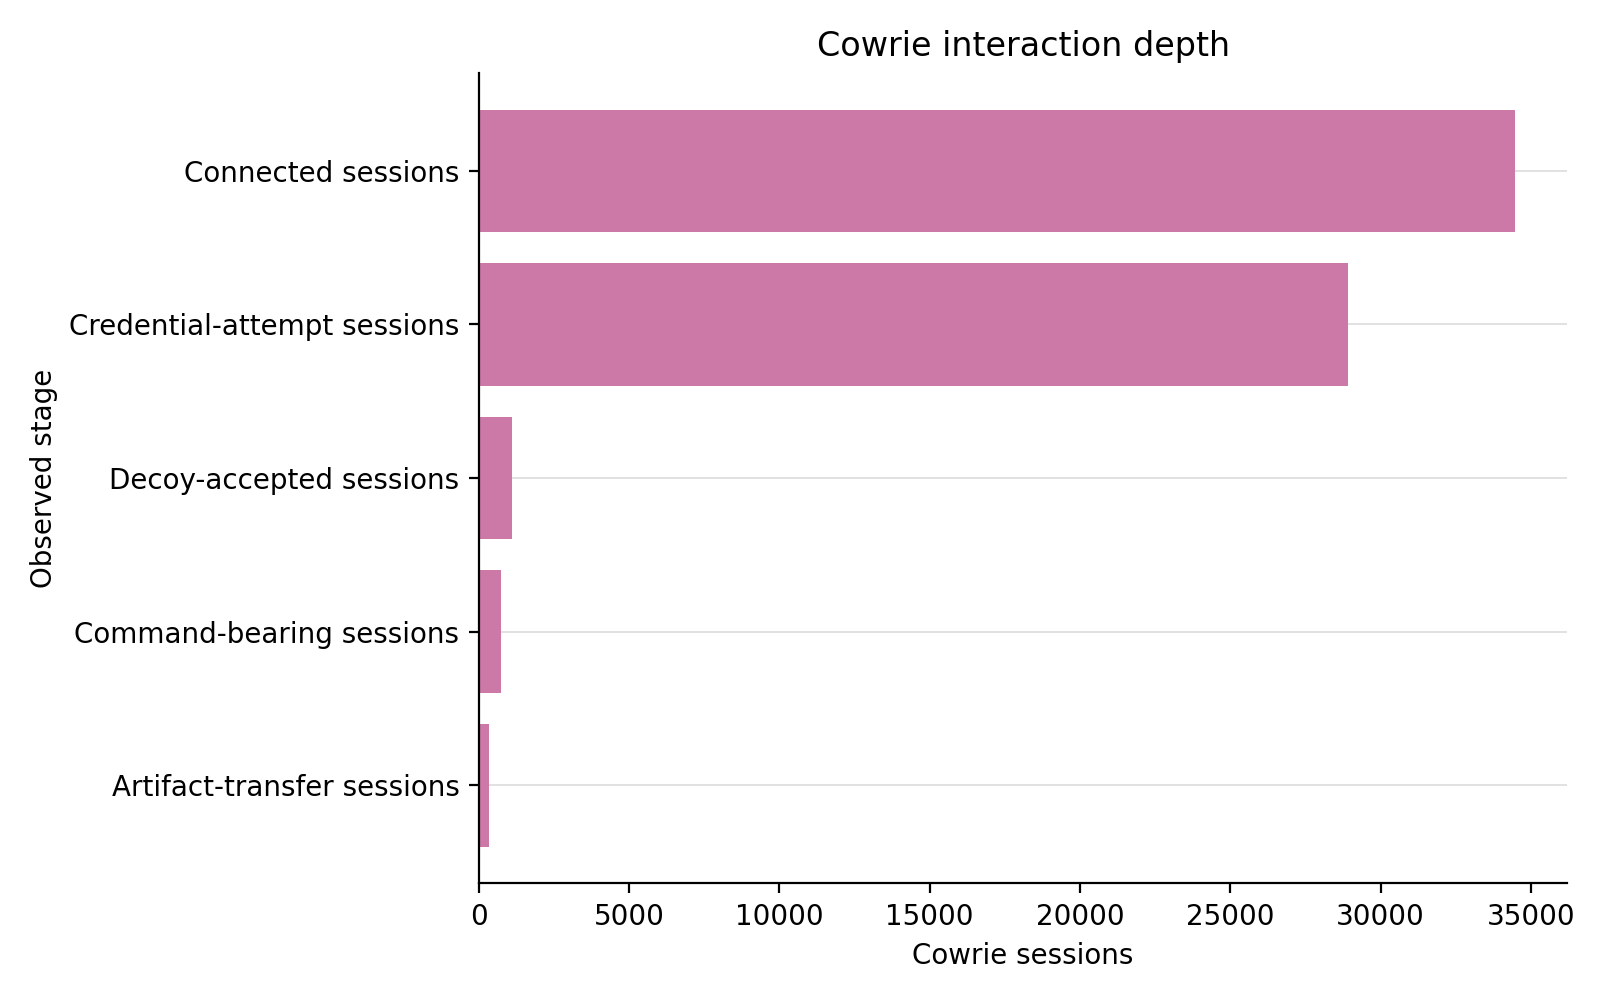
| Cowrie sessions | 34,489 | Decoy interaction sessions |
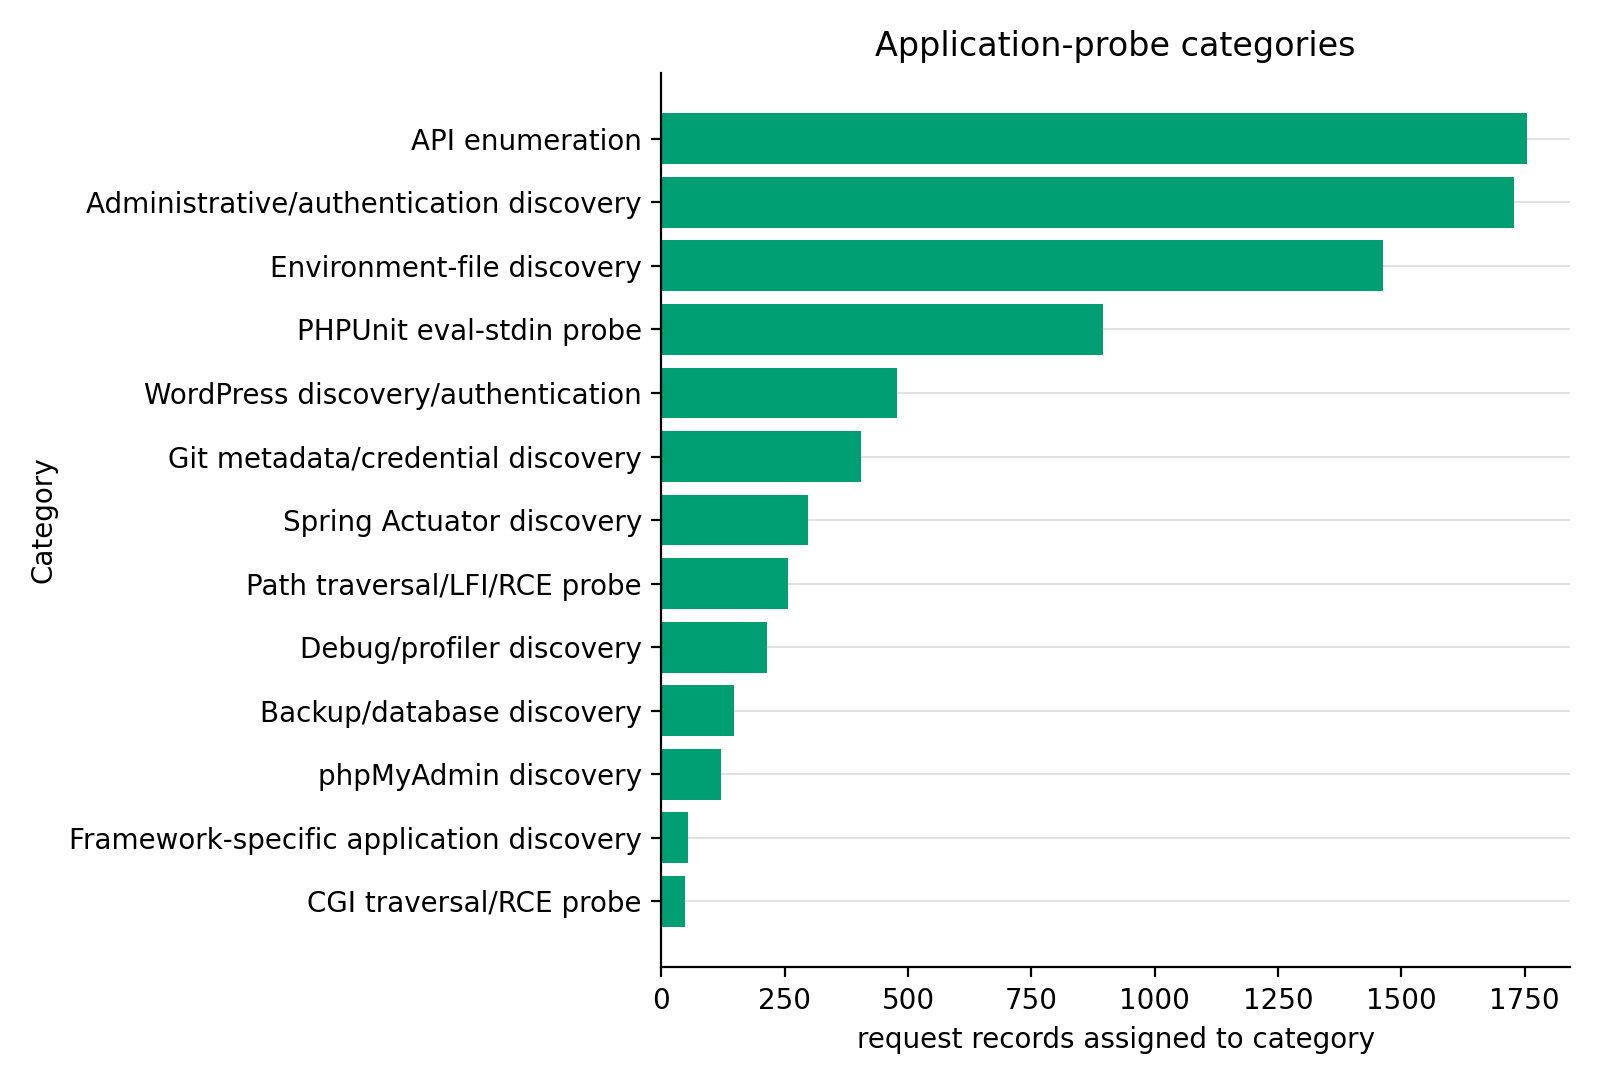
| Application request records | 22,991 | Selected sensor records; not proof of effect |
The source rule excluded 928,192 records from the external-source population. The public artifacts retain aggregate results and do not publish raw source addresses, credentials, commands, or payload material.
Among p0f contact observations, the most represented apparent source country after excluding Kosovo/Kosova labels was United States (132,693 contact observations). This is an enrichment-based descriptive result, not a nationality, identity, or attacker attribution.
Results
The seven-day derived figures answer distinct descriptive questions and retain their own population, units, and caveats. They are generated from the published metrics and tables, not from a live dashboard.
Scanner sensitivity table
| Population | Measure | Value | Qualification |
|---|---|---|---|
| A: all qualifying external traffic | external_documents | 3,796,496 | descriptive sensitivity population |
| A: all qualifying external traffic | unique_source_ips | 22,485 | descriptive sensitivity population |
| A: all qualifying external traffic | p0f_contact_tuples | 465,659 | descriptive sensitivity population |
| A: all qualifying external traffic | suricata_flows | 546,712 | descriptive sensitivity population |
| A: all qualifying external traffic | application_request_records | 22,991 | descriptive sensitivity population |
| A: all qualifying external traffic | first_external_event_seconds_from_t0 | 4.0 | relative to earliest indexed event, not exposure |
| A: all qualifying external traffic | first_credential_attempt_seconds_from_t0 | 265.106 | relative to earliest indexed event, not exposure |
| A: all qualifying external traffic | first_explicit_exploit_pattern_request_seconds_from_t0 | 2181.0 | relative to earliest indexed event, not exposure |
| B: explicit-scanner sources excluded | external_documents | 3,686,165 | descriptive sensitivity population |
| B: explicit-scanner sources excluded | unique_source_ips | 21,021 | descriptive sensitivity population |
| B: explicit-scanner sources excluded | p0f_contact_tuples | 449,579 | descriptive sensitivity population |
| B: explicit-scanner sources excluded | suricata_flows | 532,134 | descriptive sensitivity population |
| B: explicit-scanner sources excluded | application_request_records | 22,649 | descriptive sensitivity population |
| B: explicit-scanner sources excluded | first_external_event_seconds_from_t0 | 5.0 | relative to earliest indexed event, not exposure |
| B: explicit-scanner sources excluded | first_credential_attempt_seconds_from_t0 | 265.106 | relative to earliest indexed event, not exposure |
| B: explicit-scanner sources excluded | first_explicit_exploit_pattern_request_seconds_from_t0 | 2181.0 | relative to earliest indexed event, not exposure |
Attack Characterization
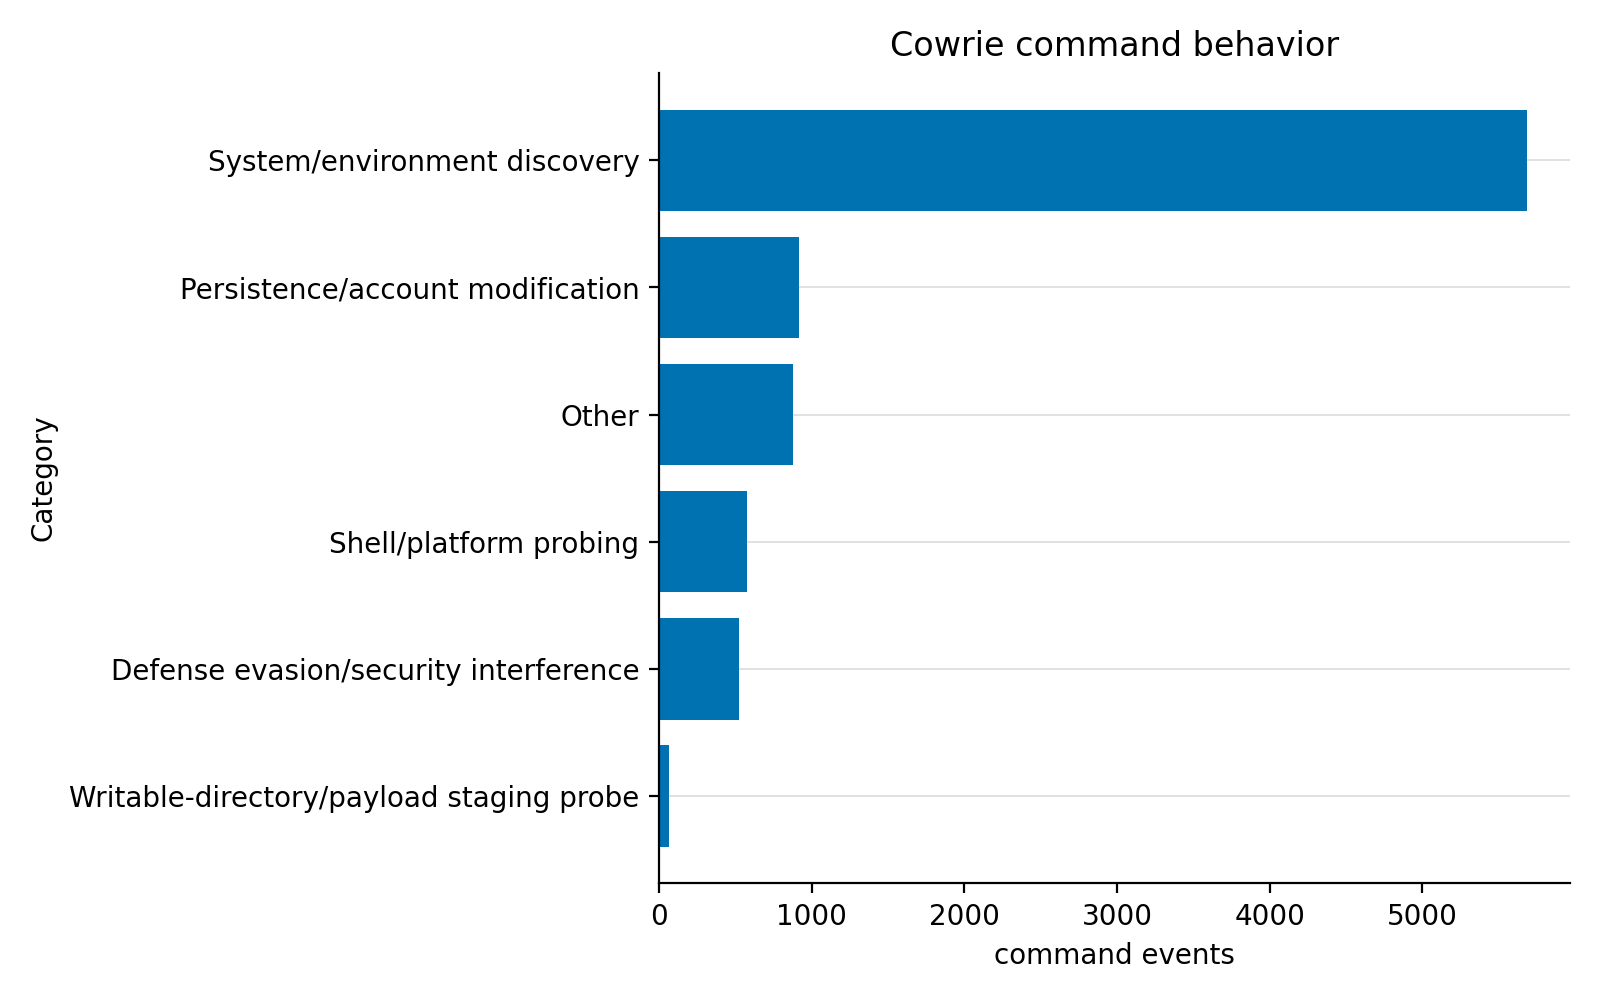
The observed record types support a conservative characterization of scanning, credential activity, and decoy interaction only at the level their telemetry records. Cowrie recorded 30,005 credential attempts and 718 command-bearing sessions. Decoy-accepted authentication and commands submitted to an emulator do not demonstrate access to a real host, execution on a real host, malware, or an identified actor. The available telemetry does not establish malware or real-host compromise.
Web Application Probing
The selected web population contains 22,991 application request records. The available sensor schemas do not prove one-to-one packet-level transaction reconstruction. Request categories are descriptive and may overlap. An exploit-shaped request, a discovery path, or a response record does not by itself establish disclosure, execution, persistence, or compromise.
Discussion
This remains a single-address, single-provider, seven-day observational case study and cannot support provider-wide or Internet-wide estimates.
The exploratory behavioral-modeling decision was omitted. Features are aggregate counts, rates, and spans; they are not semantic source labels. The result is exploratory and does not establish cause, identity, or intent. Model evaluation is omitted from interpretive analysis.
The study’s direct value is the transparent distinction between documents, contact tuples, flow records, sessions, and request records, as well as confirmed effects. It does not establish the motives, legal operators, or geographical identity of observed source addresses.
Threats to Validity
The case has one observed public address, one deployment configuration, and one bounded event-time interval. t0 is an indexed-event origin, not a verified network-exposure time. Sensor schemas have different semantics and cannot be converted into a shared attack count. Explicit scanner exclusion is a sensitivity analysis, not a ground-truth benign/malicious classifier. Apparent network enrichment, if present in the generated tables, does not establish physical location or identity.
General Defensive Implications
Organizations should maintain an asset inventory, reduce unintended exposure, apply timely security updates, use strong access controls, monitor authentication and application telemetry, and rehearse incident response. These are technology-neutral defensive practices; this single case study does not rank products or prescribe a particular platform.
Conclusion
This frozen single-address, single-provider, seven-day observational case study provides a reproducible description of qualifying unsolicited telemetry. Its counts are tied to named metrics and source tables, its figures preserve stated caveats, and its negative findings remain explicit. The results should be read as bounded observational evidence, not a discovery-latency measurement, actor attribution, provider-wide or Internet-wide estimate, or claim about source identity. t0 remains only the earliest indexed operational event, not a verified network-exposure time.
Data Dictionary
| Term | Meaning |
|---|---|
| Indexed document | One Elasticsearch record in the frozen export; not necessarily a network transaction. |
| External-source document | An indexed document whose source passed the documented external-source rule. |
| p0f contact tuple | A deduplicated TCP contact/probe observation; not a guaranteed completed connection. |
| Suricata flow record | A network-flow telemetry record; not an application session. |
| Cowrie session | Interaction with a decoy SSH/Telnet service; not evidence of real-host access. |
| Application request record | A selected honeypot application record; not proof of exploit success. |
t0 | The earliest indexed operational event in the frozen Elasticsearch corpus. |
Declarations
Author contributions: KSAL Research Team.
Funding: Not stated in the source artifact.
Competing interests: Not stated in the source artifact.
Ethics review: Not stated in the source artifact.
Data availability: Restricted raw telemetry is not publicly distributed because it may contain sensitive identifiers and interaction content. Public derived artifacts are generated from the frozen export by the accompanying scripts.
Code availability: The source repository and public artifact links will be added when approved for publication.
References
[1] Pang, R., Allman, M., Bennett, M., Lee, J., Paxson, V., and Tierney, B. A first look at modern enterprise traffic. Proceedings of the ACM SIGCOMM Internet Measurement Conference, 2005. Read the paper. ↩
[2] Wustrow, E., Karir, M., Bailey, M., Jahanian, F., and Huston, G. Internet background radiation revisited. Proceedings of the ACM SIGCOMM Internet Measurement Conference, 2010. DOI: 10.1145/1879141.1879149. ↩
[3] Durumeric, Z., Wustrow, E., and Halderman, J. A. ZMap: Fast Internet-wide scanning and its security applications. USENIX Security Symposium, 2013. USENIX publication page. ↩
[4] Vetterl, A., Clayton, R., and Walden, I. Security and privacy implications of honeypot deployments. Workshop on Cyber Security Experimentation and Test, 2018. ↩
[5] T-Pot Community. T-Pot: The All In One Multi Honeypot Platform. Authoritative project documentation, accessed for methodology context. Project documentation. ↩
Back to top